

Start with a decision, not a chart
A KayanOS dashboard turns a defined operational question into a reusable view. It can combine data-aware widgets, manual information, filters, layouts, and versions, but it never grants a viewer access to records they could not otherwise read. Design the decision first, then the data source, filter, widget, and audience. For the Directorate of Citizen Services, a useful first question is: “How many Citizen Service Requests were received and closed by Service Centre and week, and where is the queue becoming overdue?” That question is more useful than “build a chart,” because it tells you what must be counted, grouped, filtered, refreshed, and reviewed.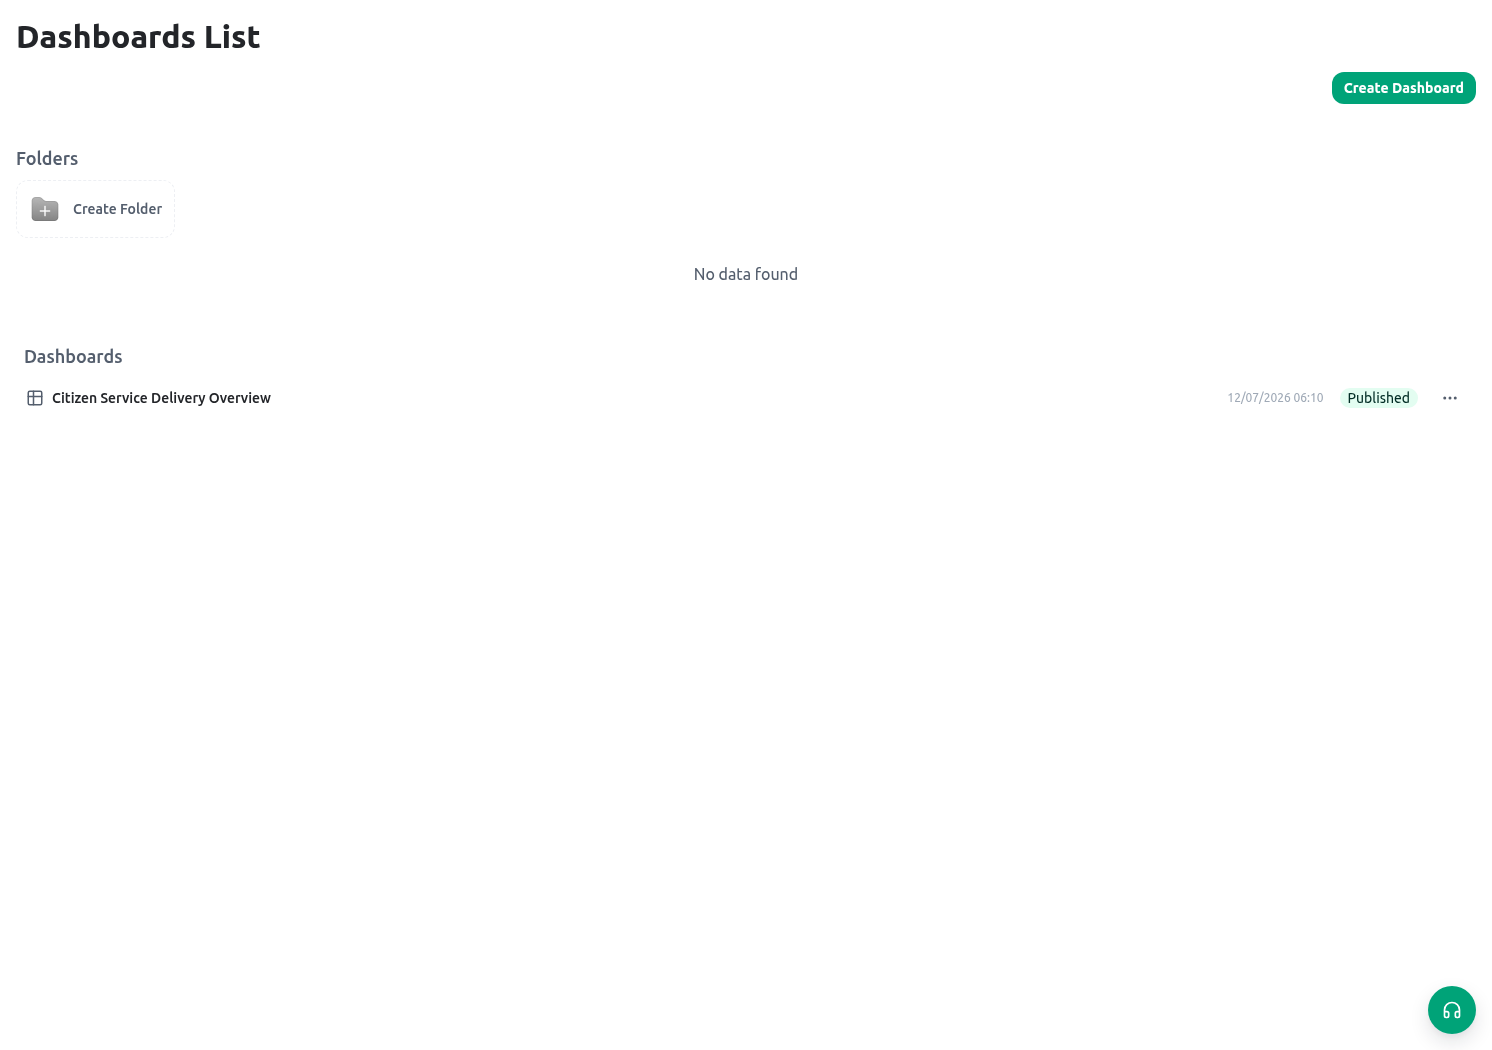
The dashboard model
Do not make one giant “all services” dashboard. Build small purpose-driven views: intake workload, inspection completion, decision backlog, or service-centre weekly performance.
Choose a widget by the decision
Use the smallest visual that supports the decision. A KPI without its denominator or date range can mislead; a map with sensitive case-level locations may be inappropriate even when the source records are visible to a narrow team.
Build a workload dashboard step by step
1. Define the measures in plain language
For the workload dashboard, write down:- Received this week: number of requests whose intake/created date is in the selected week.
- Closed this week: number of requests whose approved closed status/date is in the selected week.
- Open queue: number of requests not in the closed status group.
- Inspection completion: completed inspections divided by the approved expected inspection set, when that denominator is well defined.
2. Configure the data source deliberately
For entity-backed widgets, select the entity and only the fields required for the visual:status, service_centre, created/closed date, reference, and a non-sensitive workload indicator. For manual widgets, state the owner, refresh cadence, source-of-truth document, and date of last update. Do not mix manual and entity data in one metric without labeling the distinction.
Where a widget supports grouping, aggregation, sorting, or a row limit, start narrow. A table of the latest 25 waiting requests is easier to validate than an unbounded list. For numeric values, decide whether the widget should count records, sum a field, calculate an average, or show a percentage—then document the denominator.
3. Apply fixed filters first
Fixed filters answer the stable question, for example:4. Add viewer filters carefully
Viewer filters can let an authorized manager choose a date range, service centre, or approved dimension. KayanOS merges the relevant widget filters with viewer-selected filters. Make the purpose visible:
Filters narrow the query; they do not expand record permissions. If a viewer lacks source-record access, a widget may show a permission-denied or empty result even when the dashboard itself opens.
5. Lay out, version, and publish the view
Group the workload widgets by question: overview KPIs, queue table, time trend, then exception/inspection section. Give each widget a title that states the entity, measure, time basis, and scope—for example, “Open Citizen Service Requests — Central Service Centre — current week.” Use a versioned change process:- Edit a draft/review version with non-production or approved limited data.
- Compare the visual with a manual count and a known set of source records.
- Ask the metric owner to confirm labels, filters, status definitions, and audience.
- Publish/assign the approved version according to the released dashboard workflow.
- Record a change note when a source field, filter, denominator, or access scope changes.
Use the dashboard builder on a phone
In the widget-based dashboard builder, the AI panel starts closed on phones. Open it with the toolbar’s AI control when needed. If the bottom widget toolbar does not fit, scroll it horizontally to reach the remaining controls. A hidden panel or off-screen button does not mean you lack access. These layout controls do not grant authoring or source-data permissions. Review the canvas and save through the normal builder workflow before leaving; opening the AI panel does not save your work.Data access and privacy
Dashboard visibility and data visibility are different. A viewer may be allowed to open the dashboard yet have no readable source records for a widget, or may see only the subset allowed by their current role/scope. Treat a permission-denied/empty state as a diagnostic signal, not a reason to duplicate sensitive data into a manual widget. Before publishing any widget, answer:- Which entity/fields are queried or manually entered?
- Which viewers have underlying read access at which scopes?
- Does the visual reveal a protected value through a count, label, drill-down/table, map point, export, or analysis prompt?
- Is the date/aggregation small enough that a single case could be inferred?
- Who owns accuracy, refresh, and correction when source data is late or wrong?
Viewer mode, printing, and exports
Test the dashboard in the same viewer mode and viewport used by its audience. The viewer may use filters, and the dashboard can provide a report/print path that waits for widgets to be ready before printing. A PDF or printed report is a snapshot of what the viewer was authorized to see at that time; it must follow the organization’s handling, distribution, and retention policy. Before exporting or printing:- Set the reporting period and visible filters explicitly.
- Wait for all data widgets to load; do not capture a partial loading state as a report.
- Confirm titles, legends, table columns, language, and page breaks are understandable.
- Review the output for protected values, unintended scope, and stale manual figures.
- Store/distribute the resulting document only through an approved channel.
Test matrix
Troubleshooting
Use the separated AI analytics workspaces
In Build, AI Dashboards opens the dashboard authoring view and AI Reports opens the report conversation view. Each route keeps its own dashboard or conversation identifier in the URL and hides the other workspace tabs. Choose the destination that matches the work instead of relying on an old combined Analytics bookmark. These two authoring routes are available only to the organization owner and members assigned the built-in organization administrator role in the active organization. An ordinary member is returned to Home without the authoring workspace. Published pages and embedded dashboards keep their separate viewer permissions; sharing an AI Dashboards or AI Reports URL does not grant authoring access. An embedded DBGenie dashboard can ask KayanOS to open a referenced entity record. KayanOS resolves the current canonical destination and checks the member’s record capability again before navigating. It does not accept an arbitrary host route from the embedded content. Test one permitted record and one out-of-scope record as the intended viewer, and keep the dashboard useful when a record link is unavailable.Create or edit a dashboard from a record
An entity detail layout can contain a shared dashboard tab or section. If the configured slot is blank, an authorized administrator sees Create dashboard. Open it, build a dashboard or select an existing one in the retained record context, then choose Use this dashboard. KayanOS binds that dashboard to the entity slot once; it then appears on every record that uses the slot and receives each record’s context automatically. It does not create a separate dashboard per record. For an existing embedded dashboard, choose Edit dashboard to keep the current record context while authoring. Save changes inside the dashboard editor before choosing Done editing; the confirmation warns that unsaved editor changes will be lost. Because the asset is shared, edits apply everywhere that dashboard is used across records. Duplicate or bind a different approved asset when the design must not affect the other placements. Creation and editing require analytics product access, organization owner or built-in administrator authority,update on both Entities and Entity fields, and readable access to the host entity. An ordinary viewer sees a not-configured state for a blank slot. Once configured, the existing embedded-view permission and host-record access rules still apply. If the access check fails, retry it; do not grant administrator or broad entity access merely to fill the slot.